Function to write a table
CatTable.RdCatTable helps printing a table, if is has to be broken into multiple rows. Rowlabels will be repeated after every new break.
CatTable(tab, wcol, nrepchars, width = getOption("width"))Arguments
- tab
the rows of a table to be printed, pasted together in one string with constant columnwidth.
- wcol
integer, the width of the columns. All columns must have the same width.
- nrepchars
integer, the number of characters to be repeated with every break. This is typically the maximum width of the rowlabels.
- width
integer, the width of the whole table. Default is the width of the current command window (
getOption("width")).
Examples
options(scipen=8)
# used in bivariate description functions
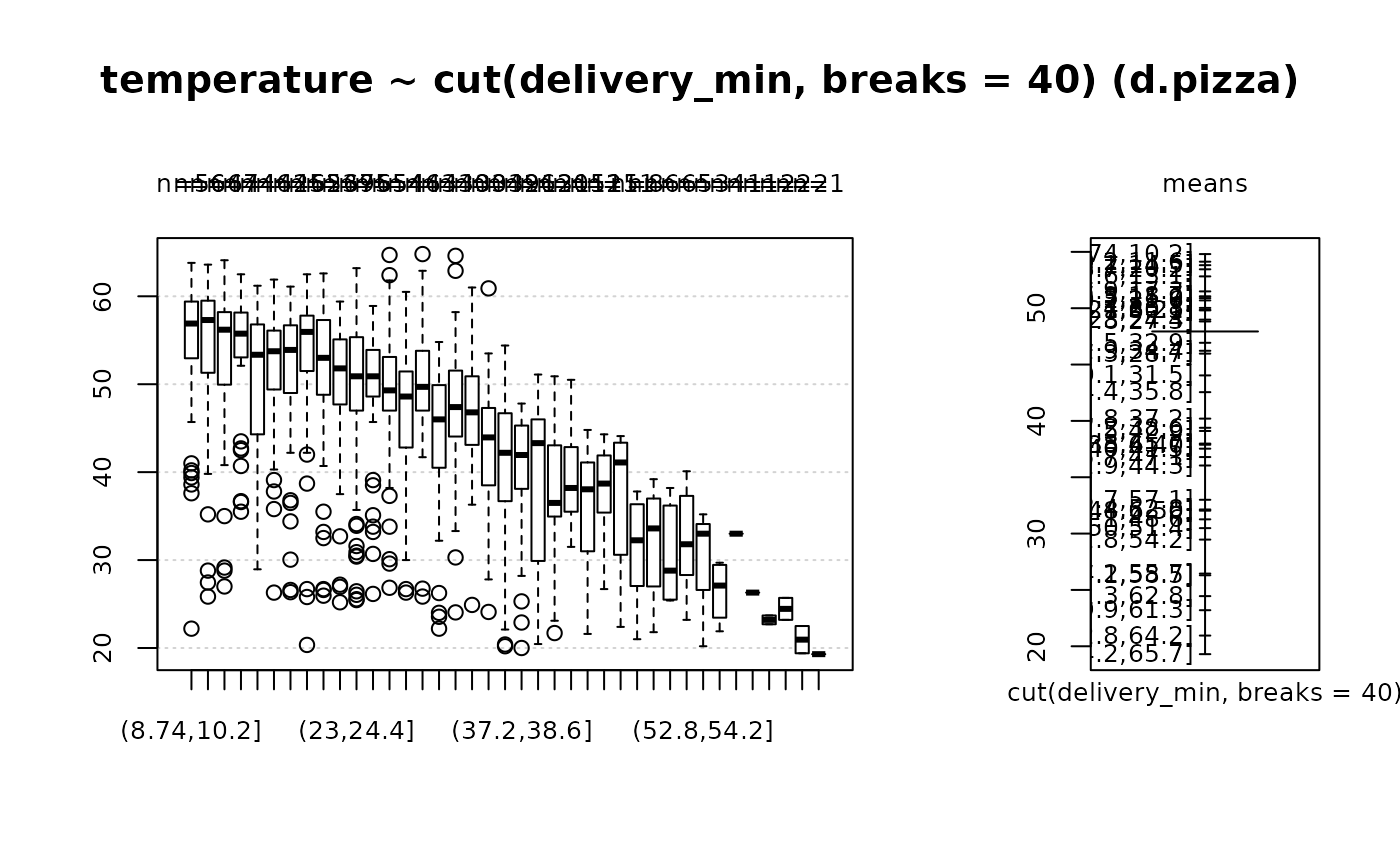
Desc(temperature ~ cut(delivery_min, breaks=40), data=d.pizza)
#> Warning: NaNs produced
#> Warning: NaNs produced
#> Warning: NaNs produced
#> ──────────────────────────────────────────────────────────────────────────────
#> temperature ~ cut(delivery_min, breaks = 40) (d.pizza)
#>
#> Summary:
#> n pairs: 1'209, valid: 1'170 (96.8%), missings: 39 (3.2%), groups: 39
#>
#>
#> (8.74,10.2] (10.2,11.6] (11.6,13.1] (13.1,14.5] (14.5,15.9]
#> mean 54.804 54.129 52.824 53.818 50.899
#> median 56.900 57.300 56.200 55.750 53.350
#> sd 7.998 8.713 9.010 6.781 7.858
#> IQR 6.325 7.850 8.250 4.800 11.675
#> n 56 66 47 44 46
#> np 4.786% 5.641% 4.017% 3.761% 3.932%
#> NAs 0 0 0 0 0
#> 0s 0 0 0 0 0
#>
#> (15.9,17.3] (17.3,18.7] (18.7,20.2] (20.2,21.6] (21.6,23]
#> mean 51.493 51.058 53.452 50.693 49.807
#> median 53.750 53.900 55.950 53.000 51.800
#> sd 7.610 9.093 8.241 8.927 7.665
#> IQR 6.500 7.700 6.200 8.500 7.400
#> n 42 45 62 53 69
#> np 3.590% 3.846% 5.299% 4.530% 5.897%
#> NAs 0 0 0 0 0
#> 0s 0 0 0 0 0
#>
#> (23,24.4] (24.4,25.8] (25.8,27.3] (27.3,28.7] (28.7,30.1]
#> mean 48.987 50.027 48.825 45.970 49.851
#> median 50.900 50.900 49.300 48.600 49.700
#> sd 9.487 6.715 7.786 8.235 6.359
#> IQR 8.350 5.300 5.975 8.375 6.800
#> n 75 65 54 44 63
#> np 6.410% 5.556% 4.615% 3.761% 5.385%
#> NAs 0 0 0 0 0
#> 0s 0 0 0 0 0
#>
#> (30.1,31.5] (31.5,32.9] (32.9,34.4] (34.4,35.8] (35.8,37.2]
#> mean 44.037 46.931 46.223 42.550 40.203
#> median 46.000 47.400 46.800 43.950 42.200
#> sd 8.537 8.414 6.895 8.145 8.881
#> IQR 9.400 7.150 7.325 8.800 10.000
#> n 43 40 30 34 39
#> np 3.675% 3.419% 2.564% 2.906% 3.333%
#> NAs 0 7 6 4 2
#> 0s 0 0 0 0 0
#>
#> (37.2,38.6] (38.6,40] (40,41.5] (41.5,42.9] (42.9,44.3]
#> mean 39.388 37.885 37.535 39.107 36.042
#> median 41.950 43.300 36.500 38.200 38.050
#> sd 8.007 10.865 6.996 5.540 6.974
#> IQR 6.975 16.100 7.650 7.350 8.950
#> n 26 13 20 15 12
#> np 2.222% 1.111% 1.709% 1.282% 1.026%
#> NAs 3 1 3 6 2
#> 0s 0 0 0 0 0
#>
#> (44.3,45.7] (45.7,47.1] (47.1,48.6] (48.6,50] (50,51.4]
#> mean 37.987 36.791 31.262 32.033 30.483
#> median 38.700 41.100 32.250 33.600 28.800
#> sd 5.136 8.303 5.891 6.499 5.481
#> IQR 6.500 12.750 8.850 7.650 8.475
#> n 15 11 8 6 6
#> np 1.282% 0.940% 0.684% 0.513% 0.513%
#> NAs 1 0 0 0 0
#> 0s 0 0 0 0 0
#>
#> (51.4,52.8] (52.8,54.2] (54.2,55.7] (55.7,57.1] (57.1,58.5]
#> mean 32.140 29.467 26.450 33.000 26.300
#> median 31.800 33.000 27.100 33.000 26.300
#> sd 6.797 8.100 3.694 <NA> <NA>
#> IQR 9.000 7.500 5.100 0.000 0.000
#> n 5 3 4 1 1
#> np 0.427% 0.256% 0.342% 0.085% 0.085%
#> NAs 1 3 0 0 0
#> 0s 0 0 0 0 0
#>
#> (59.9,61.3] (61.3,62.8] (62.8,64.2] (64.2,65.7]
#> mean 23.200 24.450 20.950 19.300
#> median 23.200 24.450 20.950 19.300
#> sd 0.707 1.768 2.192 <NA>
#> IQR 0.500 1.250 1.550 0.000
#> n 2 2 2 1
#> np 0.171% 0.171% 0.171% 0.085%
#> NAs 0 0 0 0
#> 0s 0 0 0 0
#>
#> Kruskal-Wallis rank sum test:
#> Kruskal-Wallis chi-squared = 438.79, df = 38, p-value < 2.2e-16
#>
#>
#>
 txt <- c(
paste(sample(letters, 500, replace=TRUE), collapse="")
, paste(sample(letters, 500, replace=TRUE), collapse="")
, paste(sample(letters, 500, replace=TRUE), collapse="")
)
txt <- paste(c("aaa","bbb","ccc"), txt, sep="")
CatTable(txt, nrepchars=3, wcol=5)
#> aaamhrwbxfyunfeknittaaofujbkyrlkseybfbewmzteiwfovtibkxlxesgtfeodwmbjdrtjbqdvjx
#> bbbsvejfvkflazpcaeiibpaxydxbgstpncdwdvujcbiyyrcywkvvwkafpksvbrtbxygavitcwexvte
#> ccckexjxndsaemqxvditfybvglhggzfhpvvmrpkaucrwfutnotsqnsgztbvnttdtklnkuwfqxpiitt
#>
#> aaasmnimwoszjmafuvcosaqrooudnnqjpwvjqnfvvogueufmkvthpsrplwohdmnisadxnjxmmjskou
#> bbbwewraxuzqvevqihcyzpditaarpyxkrsyqhgqzmhmcgybiabxmyxptuqmsrsamivwmcylqlesfgr
#> cccupaevnuiqjihganwpjqiwskjmkfsvvnkmqyzapaswzrcxvomzkibxawohunddcztevzhxbeskbt
#>
#> aaaokdvqnnrvhmtkcvkjjrzcdouvboxroufhisxwhlcoqctktgdmpqkudorgbevsozigplxukzyygx
#> bbbjoihpvhpqkgudqvsrskurpfxbvwksuxkghbcxwnfngffkukexlvvzefoshhocdzamjxowzhvudh
#> cccxdekamakdipycrvxhjkemzwgyuoydxbafrcegfsieggwwluzutrgvjiphetvcbfjqljdslfkrtk
#>
#> aaazwgxefafmjnxtfbtjwoxaaqtspqfumykqofiacftryyuvvqrbaukzzgwettknvgznnggwmgmaco
#> bbbtajepidmdpveyggzpzdbaqeeubkbhojstnopijgixsprymvrbwinhvssbgdrpsmfobqpxgxkhlq
#> cccrnzazvhjvdiwjjdertufvzveqnuzontuwceqojugydopmwjrkhczouobrcbvioinlorywtqllni
#>
#> aaavjsamxqhozpjbanlsobgnoahsosgxucvvaiggkfccvgklulytibywnhwwevdmgmltmniekvybze
#> bbbxheanxhlrlerlbjbganuhbthhaclqnspjzrrdspglufkrbgynqlfazftwxheipnyuwidicudqks
#> cccjifvedzdkckmouuuzttqsiruuxcgulxabkdgoqqaeuvoupmfxsbruobsvemmnntrhqrqmgcyqwe
#>
#> aaaywagidwpzwqyebzfwrduujnufpldfcaapkkcqvfrqatpjekywgpabwhllqgvhsvzkvahnrsjiup
#> bbbtjyiucevdeplecsdjbtclehvsciadvqlyuslptverkrcxuzcngisgfcmreucspfvmibsjwgpnye
#> cccehgmmopgrnmyytghjuitogkmnnalrbhptbnlrywkgyamuliodjrlvthxvytlepcjudvmhtuhqdc
#>
txt <- c(
paste(sample(letters, 500, replace=TRUE), collapse="")
, paste(sample(letters, 500, replace=TRUE), collapse="")
, paste(sample(letters, 500, replace=TRUE), collapse="")
)
txt <- paste(c("aaa","bbb","ccc"), txt, sep="")
CatTable(txt, nrepchars=3, wcol=5)
#> aaamhrwbxfyunfeknittaaofujbkyrlkseybfbewmzteiwfovtibkxlxesgtfeodwmbjdrtjbqdvjx
#> bbbsvejfvkflazpcaeiibpaxydxbgstpncdwdvujcbiyyrcywkvvwkafpksvbrtbxygavitcwexvte
#> ccckexjxndsaemqxvditfybvglhggzfhpvvmrpkaucrwfutnotsqnsgztbvnttdtklnkuwfqxpiitt
#>
#> aaasmnimwoszjmafuvcosaqrooudnnqjpwvjqnfvvogueufmkvthpsrplwohdmnisadxnjxmmjskou
#> bbbwewraxuzqvevqihcyzpditaarpyxkrsyqhgqzmhmcgybiabxmyxptuqmsrsamivwmcylqlesfgr
#> cccupaevnuiqjihganwpjqiwskjmkfsvvnkmqyzapaswzrcxvomzkibxawohunddcztevzhxbeskbt
#>
#> aaaokdvqnnrvhmtkcvkjjrzcdouvboxroufhisxwhlcoqctktgdmpqkudorgbevsozigplxukzyygx
#> bbbjoihpvhpqkgudqvsrskurpfxbvwksuxkghbcxwnfngffkukexlvvzefoshhocdzamjxowzhvudh
#> cccxdekamakdipycrvxhjkemzwgyuoydxbafrcegfsieggwwluzutrgvjiphetvcbfjqljdslfkrtk
#>
#> aaazwgxefafmjnxtfbtjwoxaaqtspqfumykqofiacftryyuvvqrbaukzzgwettknvgznnggwmgmaco
#> bbbtajepidmdpveyggzpzdbaqeeubkbhojstnopijgixsprymvrbwinhvssbgdrpsmfobqpxgxkhlq
#> cccrnzazvhjvdiwjjdertufvzveqnuzontuwceqojugydopmwjrkhczouobrcbvioinlorywtqllni
#>
#> aaavjsamxqhozpjbanlsobgnoahsosgxucvvaiggkfccvgklulytibywnhwwevdmgmltmniekvybze
#> bbbxheanxhlrlerlbjbganuhbthhaclqnspjzrrdspglufkrbgynqlfazftwxheipnyuwidicudqks
#> cccjifvedzdkckmouuuzttqsiruuxcgulxabkdgoqqaeuvoupmfxsbruobsvemmnntrhqrqmgcyqwe
#>
#> aaaywagidwpzwqyebzfwrduujnufpldfcaapkkcqvfrqatpjekywgpabwhllqgvhsvzkvahnrsjiup
#> bbbtjyiucevdeplecsdjbtclehvsciadvqlyuslptverkrcxuzcngisgfcmreucspfvmibsjwgpnye
#> cccehgmmopgrnmyytghjuitogkmnnalrbhptbnlrywkgyamuliodjrlvthxvytlepcjudvmhtuhqdc
#>