Paints the background of the plot, using either the figure region, the plot region or both. It can sometimes be cumbersome to elaborate the coordinates and base R does not provide a simple function for that.
Bg(col = "grey", region = c("plot", "figure"), border = NA)
Arguments
- col
the color of the background, if two colors are provided, the first is used for the plot region and the second for the figure region.
- region
either "plot" or "figure"
- border
color for rectangle border(s). Default is NA for no borders.
Author
Andri Signorell <andri@signorell.net>
Examples
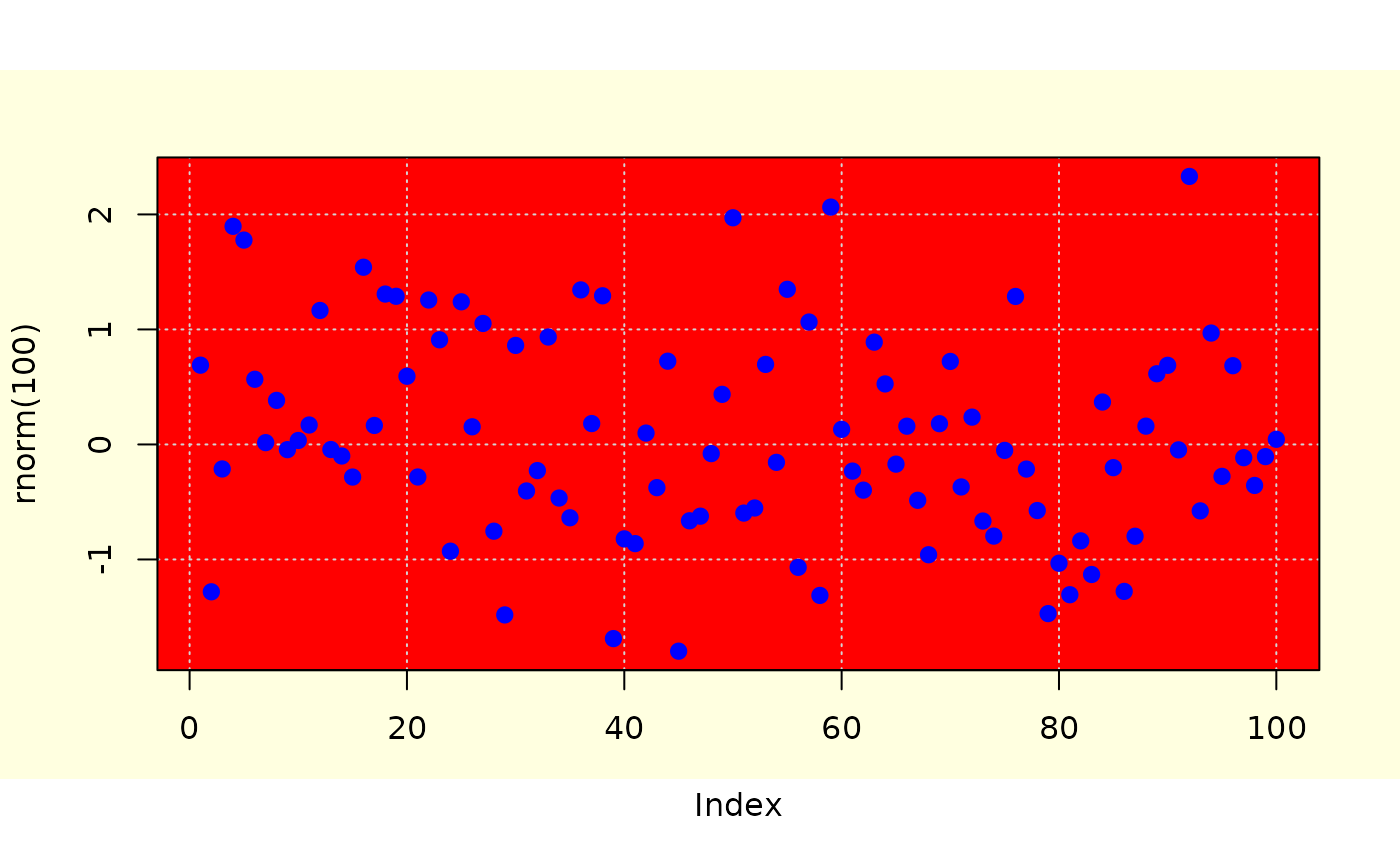
# use two different colors for the figure region and the plot region
plot(x = rnorm(100), col="blue", cex=1.2, pch=16,
     panel.first={Bg(c("red", "lightyellow"))
                  grid()})